Click the Graph
button (![]() ) in the Search Results page. The results are displayed
in a scatter graph. View an
example?
) in the Search Results page. The results are displayed
in a scatter graph. View an
example?
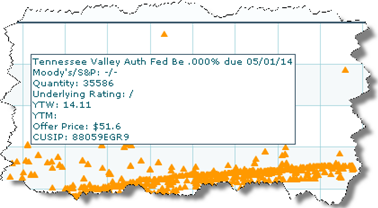
Hover over a point on the graph to view the Bond Detail rollover for the offering. View an example?
Click a data point on the graph to display the Bond Offering Detail tab of the Bond Offering Detail overlay.
Enlarge (zoom) an area of the graph, if desired.
Select an offering view, if desired.

